Liam's Blog


  • Home

  • Archives

  • Tags

  • Categories

  • Photos

  • About

LeetCode #20 Valid Parentheses

Posted on 2018-09-11 | Post modified 2018-09-12 | In Languages , LeetCode , Python , Difficulties , Data Structures , Easy , Stack , String , Dictionary

Problem

Given a string containing just the characters '(', ')', '{', '}', '[' and ']', determine if the input string is valid.

An input string is valid if:

  1. Open brackets must be closed by the same type of brackets.
  2. Open brackets must be closed in the correct order.

Examples

1
2
Input: "()"
Output: true
1
2
Input: "()[]{}"
Output: true
1
2
Input: "(]"
Output: false
1
2
Input: "([)]"
Output: false
1
2
Input: "{[]}"
Output: true
Read more »

LeetCode #2 Add Two Numbers

Posted on 2018-09-11 | Post modified 2018-09-12 | In Languages , LeetCode , Python , Difficulties , Data Structures , Medium , Linked List , Built-in , divmod

Problem

You are given two non-empty linked lists representing two non-negative integers. The digits are stored in reverse order and each of their nodes contain a single digit. Add the two numbers and return it as a linked list.

You may assume the two numbers do not contain any leading zero, except the number 0 itself.

Example

1
2
3
Input: (2 -> 4 -> 3) + (5 -> 6 -> 4)
Output: 7 -> 0 -> 8
Explanation: 342 + 465 = 807.
Read more »

LeetCode #206 Reverse Linked List

Posted on 2018-09-11 | Post modified 2018-09-11 | In Languages , LeetCode , Python , Difficulties , Algorithms , Data Structures , Easy , Recursive , Linked List , Iterative

Problem

Reverse a singly linked list.

Example

1
2
Input: 1->2->3->4->5->NULL
Output: 5->4->3->2->1->NULL
Read more »

LeetCode #141 Linked List Cycle

Posted on 2018-09-11 | Post modified 2018-09-12 | In Languages , LeetCode , Python , Difficulties , Algorithms , Data Structures , Easy , Two Pointers , Linked List

Problem

Given a linked list, determine if it has a cycle in it.

Read more »

LeetCode #155 Min Stack

Posted on 2018-09-11 | Post modified 2018-09-11

Problem

Design a stack that supports push, pop, top, and retrieving the minimum element in constant time.

  • push(x) – Push element x onto stack.
  • pop() – Removes the element on top of the stack.
  • top() – Get the top element.
  • getMin() – Retrieve the minimum element in the stack.

Example

1
2
3
4
5
6
7
8
MinStack minStack = new MinStack();
minStack.push(-2);
minStack.push(0);
minStack.push(-3);
minStack.getMin(); --> Returns -3.
minStack.pop();
minStack.top(); --> Returns 0.
minStack.getMin(); --> Returns -2.
Read more »

LeetCode #148 Sort List

Posted on 2018-09-11 | Post modified 2018-09-13 | In Languages , LeetCode , Python , Difficulties , Algorithms , Data Structures , Medium , Linked List , Divide and Conquer

Problem

Sort a linked list in O(n log n) time using constant space complexity.

Examples

1
2
put: 4->2->1->3
Output: 1->2->3->4
1
2
Input: -1->5->3->4->0
Output: -1->0->3->4->5
Read more »

Introduction to Logic, Logic Programming Concepts and Languages (Part 1)

Posted on 2018-09-10 | Post modified 2018-10-13 | In Languages , Prolog , Introduction to Logic , Mathematical Formalizations , Propositional Logic

Mathematical Formalizations in Logic

Why formalize language?

  • to remove ambiguity

  • to represent facts on a computer and use it for proving, proof-checking, etc.

  • to detect unsound reasoning in arguments

    What is unsound?

Logic

  • Mathematical logic is a tool for dealing with formal reasoning.
    • formalization of natural language and reasoning methods
  • Logic does:
    • assess if an argument is Valid or Invalid
  • Logic does not directly:
    • assess the truth of atomic statements
Read more »

LeetCode #35 Search Insert Position

Posted on 2018-09-08 | Post modified 2018-09-08

Problem

Given a sorted array and a target value, return the index if the target is found. If not, return the index where it would be if it were inserted in order.

You may assume no duplicates in the array.

Examples

1
2
Input: [1,3,5,6], 5
Output: 2
1
2
Input: [1,3,5,6], 2
Output: 1
1
2
Input: [1,3,5,6], 7
Output: 4
1
2
Input: [1,3,5,6], 0
Output: 0
Read more »

LeetCode #11 Container With Most Water

Posted on 2018-09-08 | Post modified 2018-09-08 | In Languages , LeetCode , Python , Difficulties , Algorithms , Data Structures , Medium , Array , Brute Force , Greedy

Problem

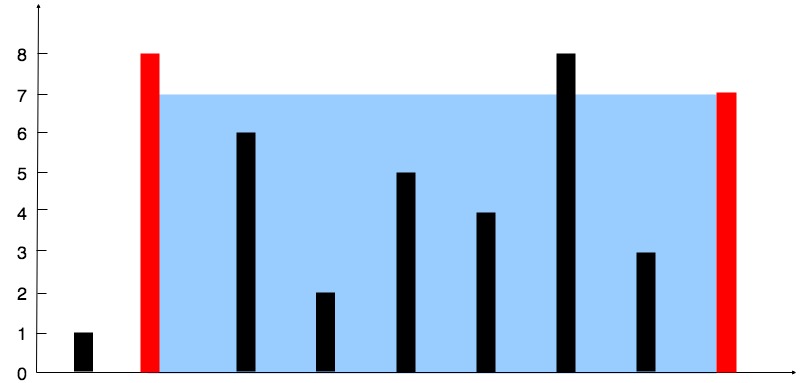
Given n non-negative integers a1, a2, …, an , where each represents a point at coordinate (i, ai). n vertical lines are drawn such that the two endpoints of line i is at (i, ai) and (i, 0). Find two lines, which together with x-axis forms a container, such that the container contains the most water.

Example

img

The above vertical lines are represented by array [1,8,6,2,5,4,8,3,7]. In this case, the max area of water (blue section) the container can contain is 49.

Note

You may not slant the container and n is at least 2.

Read more »

Correlation

Posted on 2018-09-08 | Post modified 2018-09-11 | In Data Science , Correlation

Correlation Analysis

Correlation Coefficients: Pearson and Spearman Rank

These are two primary statistics used to measure correlation. Both operate on the same -1 to 1 scale. While -1 means anti-correlated, 1 means fully correlated and 0 means uncorrelated.

  • Pearson correlation
  • Spearman rank correlation
    • Counts the number of disordered pairs
    • NOT how well the data fits a line
    • Thus better with non-linear relationships and outliers

The Power and Significance of Correlation

  • Strength of correlation $r^2$

    The square of the sample correlation coefficient estimates the fraction of the variance in Y explained by X in a simple linear regression.

    • The predictive value of a correlation decreases quadratically with r

    • Variance Reduction and $r^2$

      If there is a good linear fit f(x), then the residuals y - f(x) will have lower variance than y

  • Statistical significance

    • The statistical significance of a correlation depends upon its sample size n as well as r.

    • Even small correlations become significant (at the 0.05 level) with large-enough sample sizes.

      • This motivates big data multiple parameter models:

        Each single correlation may explain/predict only small effects, but large numbers of weak but independent correlations may together have strong predictive power.

Correlation Does Not Imply Causation

  • At best, the implication works only one way. But many observed correlations are completely spurious, with neither variable having any real impact on the other.

  • Generally speaking, few statistical tools are available to tease out whether A really causes B. We can conduct controlled experiments, if we can manipulate one of the variables and watch the effect on the other.

Detecting Periodicities by Autocorrelation

  • Generally speaking, the autocorrelation function for many quantities tends to be highest for very short lags. This is why long-term predictions are less accurate than short-term forecasts: the autocorrelations are generally much weaker. But periodic cycles do sometimes stretch much longer.

  • Time-series data often exhibits cycles which affect its interpretation

  • A cycle of length k can be identified by unexpectedly large autocorrelation between S[t] and S[t+k] for all 0 < t < n - k
  • Computing the lag-k autocorrelation takes O(n), but the full set can be computed in O(n log n) via the Fast Fourier transform (FFT).

Logarithms

Logarithms and Multiplying Probabilities

  • Logarithms were first invented as an aide to computation, by reducing the problem of multiplication to that of addition.
  • Multiplying long chains of probability yield very small numbers that govern the chances of very rare events. There are serious numerical stability problems with floating point multiplication on real computers.
  • Summing logs of probabilities is more numerically stable than multiplying them

Logarithms and Ratios

  • Always plot logarithms of ratios

Logarithms and Normalizing Skewed Distributions

  • Hitting a skewed data distribution with a log often yields a more bell-shaped distribution

Calculate the correlation coefficients by python

Using scipy.stats.pearsonr(x, y)

Calculates a Pearson correlation coefficient and the p-value for testing non-correlation.

The Pearson correlation coefficient measures the linear relationship between two datasets. Strictly speaking, Pearson’s correlation requires that each dataset be normally distributed. Like other correlation coefficients, this one varies between -1 and +1 with 0 implying no correlation. Correlations of -1 or +1 imply an exact linear relationship. Positive correlations imply that as x increases, so does y. Negative correlations imply that as x increases, y decreases.

The p-value roughly indicates the probability of an uncorrelated system producing datasets that have a Pearson correlation at least as extreme as the one computed from these datasets. The p-values are not entirely reliable but are probably reasonable for datasets larger than 500 or so.

Parameters: x : (N,) array_likeInput y : (N,) array_likeInput
Returns: (Pearson’s correlation coefficient, 2-tailed p-value)

Using scipy.stats.spearmanr(a, b = None, axis = 0)

Calculates a Spearman rank-order correlation coefficient and the p-value to test for non-correlation.

The Spearman correlation is a nonparametric measure of the monotonicity of the relationship between two datasets. Unlike the Pearson correlation, the Spearman correlation does not assume that both datasets are normally distributed. Like other correlation coefficients, this one varies between -1 and +1 with 0 implying no correlation. Correlations of -1 or +1 imply an exact monotonic relationship. Positive correlations imply that as x increases, so does y. Negative correlations imply that as x increases, y decreases.

The p-value roughly indicates the probability of an uncorrelated system producing datasets that have a Spearman correlation at least as extreme as the one computed from these datasets. The p-values are not entirely reliable but are probably reasonable for datasets larger than 500 or so.

Parameters: a, b : 1D or 2D array_like, b is optional
One or two 1-D or 2-D arrays containing multiple variables and observations. Each column of a and b represents a variable, and each row entry a single observation of those variables. See also axis. Both arrays need to have the same length in the axis dimension.
axis : int or None, optional
If axis=0 (default), then each column represents a variable, with observations in the rows. If axis=0, the relationship is transposed: each row represents a variable, while the columns contain observations. If axis=None, then both arrays will be raveled.
Returns: rho : float or ndarray (2-D square)
Spearman correlation matrix or correlation coefficient (if only 2 variables are given as parameters. Correlation matrix is square with length equal to total number of variables (columns or rows) in a and b combined.
p-value : floatThe two-sided p-value for a hypothesis test whose null hypothesis is that two sets of data are uncorrelated, has same dimension as rho.

Using pandas.corr

clean_data[‘dist’].corr(clean_data[‘fare_amount’])

Reference

Lecture 5: Correlation

The Data Science Design Manual Chapter 2.3, 2.4

1…131415…18
Liam Wang

Liam Wang

Liam's Personal Blog

174 posts
133 categories
64 tags
© 2019 Liam Wang
Powered by Hexo
Theme - NexT.Muse